
Google Analytics (GA) is able to provide a deeper understanding of how customers are using your e-commerce site by providing invaluable insights to help drive success. Since it is such a vast data analytics program, it can be difficult to find out which reports and analytics features are best for your site. In this article, we recommend the five best Google Analytics features for e-commerce websites that go beyond the basic “bounce rate”, “pages visited”, and “number of visits” type of metrics.
Essential Features
1. Track Conversions
Conversion tracking can be used to monitor key activities made by consumers. For example, registering for emails or purchasing a product. These conversions are best tracked using macro-goals and micro-goals. Macro-goals are used to track lead generation and ecommerce transactions, while micro-goals can be used to track other smaller/site-specific activities.
Once the goals have been created they can be used to visualize and understand how consumers typically act on your site. In order to create these visualizations, you can utilize the Goal Flow Report. Basically, this report highlights any abnormalities or unexpected drop-offs in the user journey, so you know what areas need attention.
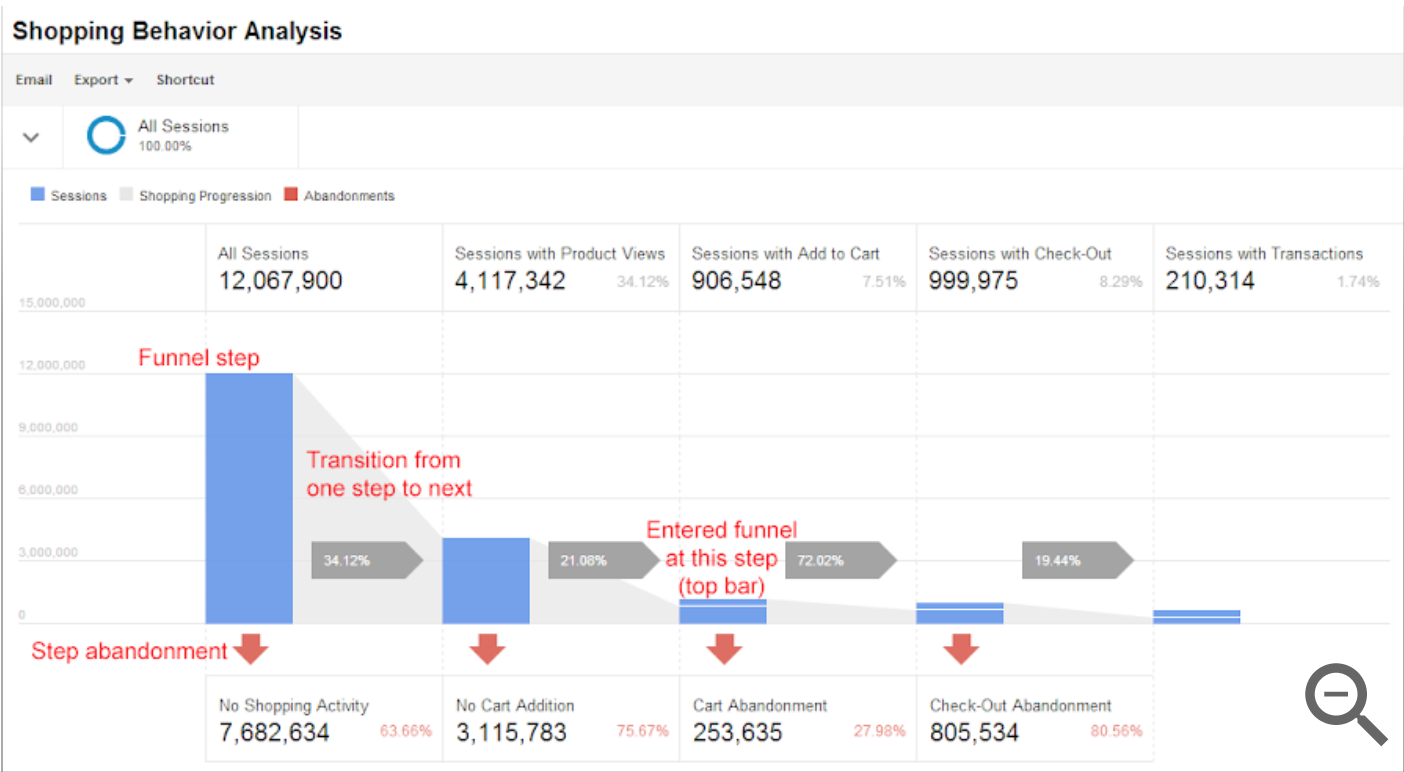
2. Shopping and Checkout Behavior Analysis
The Shopping & Checkout Behavior Analysis reports essentially give a deeper look into the metrics observed in the conversion tracking feature mentioned above. The shopping behavior analysis allows you to see how each customer moves through the funnel. For example, you will be able to see if a customer adds an item to their cart, leaves the site, then comes back (re-entering the funnel) to make a purchase in a new session. Once this data is collected it can be visualized and segmented, so you are able to analyze each portion of the shopping funnel.
Let’s say you notice a high abandonment rate at a certain stage of the checkout. You can choose from a list of default dimensions to gain a deeper understanding of how a segment of users behaves at a particular funnel stage. Add a "Device Category" dimension to the report to determine which users with a specific device category are exiting the funnel at which stage. Possibly, mobile users abandon the checkout process at a certain stage, but desktop users do not. This may indicate that something occurring at this stage, such as a bug or slow site speed, is causing mobile users to leave the site. This valuable information will assist you in identifying your users' greatest pain points, allowing you to address them immediately.
The Checkout Behavior funnel is very similar to the Shopping Behavior funnel, but it organizes data from consumers once they have added an item to their cart rather than when they first started shopping. Both are great additions to the Goal Flow Report, allowing for a deeper dive into the user journey.
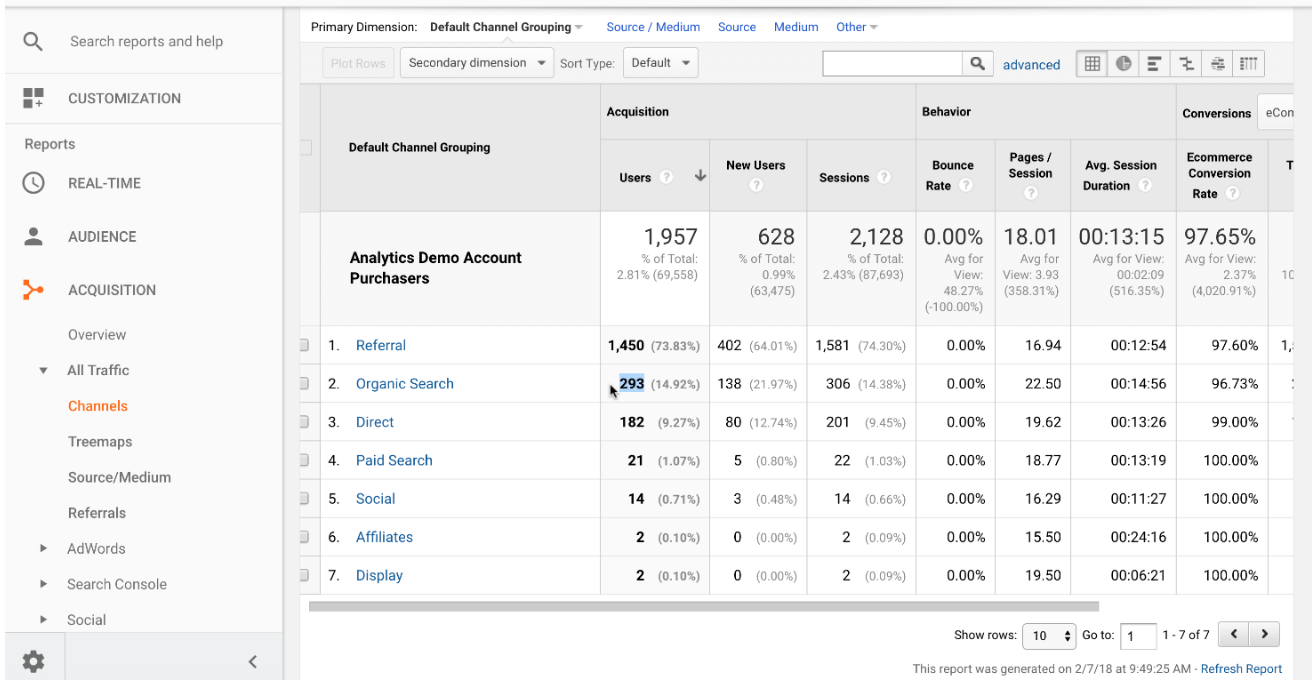
3. Channel Groupings
Similar to the segmentation feature that works with the Shopping & Checkout Behavior Analysis, channel groupings can be used to organize and sort data. This allows you to segment traffic sources into identifiable groups that best suit your site’s needs. Channel groupings can be used to compare metrics such as which ads are contributing to the most traffic, how successful your partner referral programs are, and how much organic search traffic is coming to your site.
As an example, suppose you allocated a larger portion of your marketing budget to Google ads because they performed well at this time last year. This year, despite having a smaller advertising budget, Instagram is outperforming your Google ads. You can use this information to reduce your CPC by increasing your spending on advertisements with better performance.
With access to specific traffic source data, you can answer questions such as "Are my SEO efforts paying off?", "Which websites are referring me the best prospects?", and "How many visitors are coming from Facebook and other social media channels?" You will have an intimate understanding of your traffic sources and which channels drive the highest increase to your KPIs when utilizing channel groupings.

4. Site Search
Site search analytics allow you to gain insight into what is happening within your site. You can see when a specific item is gaining searches and traffic, as well as if some products are selling at a higher rate than normal. The goal of this information is to assist you with site strategy. Based on the data this metric gives you, strategic decisions can be made in regards to which products are being featured on the homepage, which products are being discounted, and other marketing strategy decisions.

5. Enhanced eCommerce
The Enhanced Ecommerce portion of Google Analytics encompasses many features, but the main point is that it provides a vast amount of knowledge that can be used for taking actionable steps on your website. From product & sales performance to product & order coupon data, the enhanced ecommerce feature contains the most high value reports and metrics that GA offers.
The product & sales performance feature within enhanced ecommerce can provide reports pertaining to revenue data and conversion rates, average transaction, average order value, refunds, and other essential metrics. It also allows you to view product list performance reporting that provides product attribution data for last-minute conversion.
The product & order coupon date refers to information collected on coupon performance. It allows you to view coupon usage levels from both a product-based and order-based coupon perspective. These reports provide metrics regarding revenue, transactions, average value, unique purchases, and average product revenue per purchase.

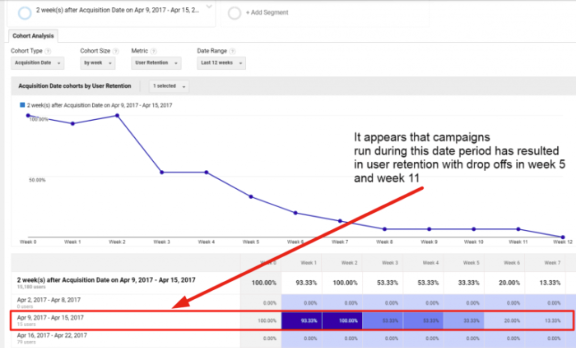
6. Cohort Analysis
Cohort Analysis is a useful Google Analytics feature that gives marketers and small businesses an overall picture of how their site is performing as well as detailed insights into user behavior. In Google Analytics, a cohort is defined as a group of people who share a similar value. Analyzing how long an average visitor returns to your site, as well as the average time between purchases, is an example of this type of analysis in action. You can then use this data to effectively predict when the cohort's next purchase will occur.
Sort by Cohort Type and "Per User" metrics to see the average number of actions taken by each cohort member on your site. Goal completions per user, revenue per user, sessions per user, and other metrics are examples of user metrics for a cohort. This information can then be used to learn more about the segments you've already created, your users' shopping habits, and the impact of any major business events.
7. * Bonus: Utilize Benchmarks
Google Analytics aggregates date from other companies in your industry, so you can see how well your website is performing compared to competitors. You can also use benchmarks to see which aspects of your site are the highest performing and which need some improvement.

Sources:
- Bolt: https://www.bolt.com/thinkshop/setup-google-analytics-for-ecommerce
- TheGood: https://thegood.com/insights/ecommerce-google-analytics-reports/#h-channel-groupings
- Google Support: https://support.google.com/analytics/answer/6014872?hl=en#zippy=%2Cin-this-article
- Shopify: https://www.shopify.com/blog/14681601-google-analytics-for-ecommerce-a-beginners-guide
- Loves Data: https://www.lovesdata.com/blog/site-search-reports (image)
- B2C: https://www.business2community.com/search-engine-optimization/the-definitive-guide-to-google-analytics-4-02422739 (image)
- Data Driven U: https://www.datadrivenu.com/channel-grouping-google-analytics/ (image)
- Neil Patel: https://neilpatel.com/blog/cohort-analysis-google-analytics/ (image)